 The U.S Treasury Yields tab displays treasury
yield data by time period and treasury type.
The U.S Treasury Yields tab displays treasury
yield data by time period and treasury type. The U.S Treasury Yields tab displays treasury
yield data by time period and treasury type.
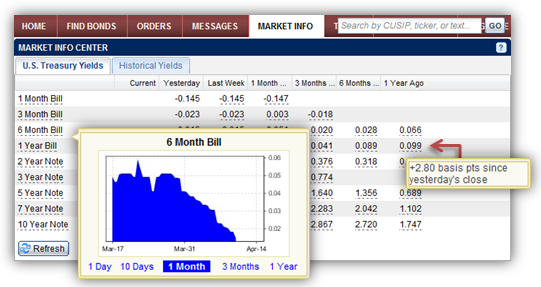
Hover over a treasury type to display a line chart with yield on the y-axis and time frame on the x-axis.
To change the time period for the line chart, click a link at the bottom of the chart. The intervals on the axes change to accommodate the selected period.
Hover over a table cell to display the difference in basis points, between yesterday’s closing value and the previous period.
![]()
 |