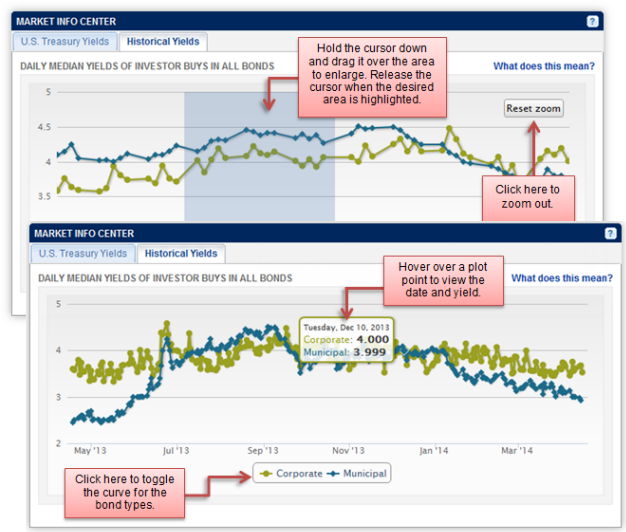
The Historical Yields tab of the Market Info Center panel plots the daily median yields for corporate and municipal bonds in each major ratings agency grade and maturity category for the previous 12 months.
Hover over a plot point to view the day and yield.
Click an asset type to change the maturity and curve.
Hold and drag the cursor to zoom into the graph. Click Reset Zoom to zoom out of the graph.
![]()
 |