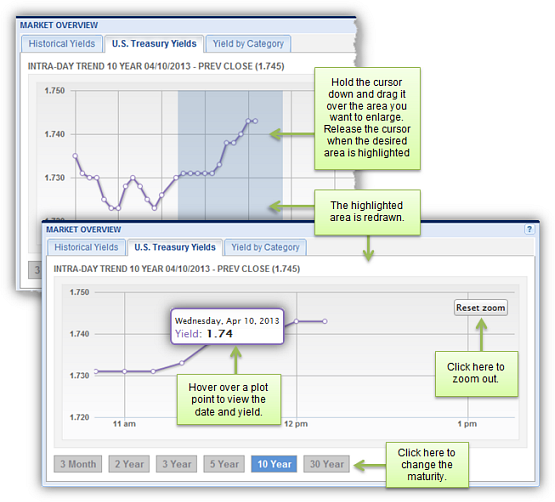
The U.S. Treasury Yields tab of the Market Overview panel in the Home page plots today's yield movement for U.S. treasury bonds. The graph is updated every ten minutes, and is available for each of the U.S. treasury bond maturity periods. The selected maturity period and the closing yield from the previous trading day is displayed above the graph.
Hover over a plot point to view the day and yield.
Click a button at the bottom of the graph to change the maturity and curve.
Hold and drag the cursor to zoom into the graph. Click Reset zoom to zoom out of the graph.
![]()
|
|
|