Understanding Duration
 The "Understanding Duration"
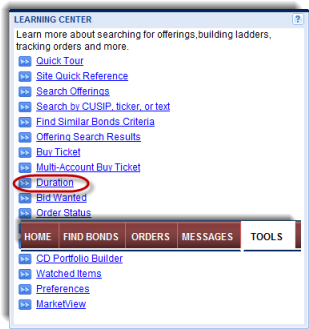
tip sheet in the BondWorks Learning Center
on the Tools page comprehensively explains how
interest rate changes affect bond prices. This tip sheet includes several
charts that graphically illustrate duration and its affects. Below is
a condensed version of information contained in the tip sheet.
The "Understanding Duration"
tip sheet in the BondWorks Learning Center
on the Tools page comprehensively explains how
interest rate changes affect bond prices. This tip sheet includes several
charts that graphically illustrate duration and its affects. Below is
a condensed version of information contained in the tip sheet.
A fixed income investment consists of a series of cash flows an investor
receives over the life of a bond. These cash flows can be in one of the
following forms:
Coupons (periodic interest payments)
Periodic return of principal (available with some mortgage backed
or structured asset bonds)
Return of principal at final maturity or an earlier call date.
The size, timing and frequency of these cash flow payments influence
all bond calculations, including duration which can be described as “the
average time it takes to get your money back."
Types of Duration
Duration values change as market values change and time passes. The
practical duration measures below define the boundaries of potential price
movement (volatility) for possible price/yield values on any given date.
Each applies to an approximate 1% change (100 basis points) in the yield
calculation specified.
Modified Duration to the Earliest Call—Yield change calculated to
the earliest call date; the most conservative and least price movement
given a 1% change in interest rates.
Modified Duration to Worst—Yield change calculated to
the priced to worst date; generally used to reflect the behavioral characteristics
of a bond as of a specific price/yield and date; consistent with industry
calculations, always calculated to the priced to worst date, including
all call features.
Modified Duration to Maturity—Yield
change calculated to final maturity date. This reflects the most aggressive
and greatest price movement given a 1% change in interest rates.
